
Chinese semiconductors and the MAG7 are getting weaker while the AUD, Europe and other country’s equities gain. Is this where the rotation is doing?
| Symbol | Daily | Weekly | Monthly | Notes |
| SPX Score: Daily: 0 Weekly: – 1 Monthly: 2 | – Touched Bottom of Keltner and sliding along it + At Support and bounced – Momentum bearish + Anti Measured Move hit * Cycle Low: usually happens with Anti’s * Squeeze fired bearish: Might have 1-3 more bearish bars to go. – Rainbow EMA is bearish but, price is extended to the Keltner + price > 200 | * Showing Squeeze w/ decreasing bull momo – Cycle High – Momentum Bearish MACD + 10 SMA > 34 EMA but, hooking down – DMI bearish + price > 200 | + 10 SMA angling up with price above it. Bullish + price > 200 | |
| NDX Score: Daily: – 3 Weekly: – 2 Monthly: 2 | – Touched Bottom of Keltner – Rejecting support + Anti completed MM * Cycle Low: usually happens with Anti’s – Rainbow EMA bearish – price < 200 * still a gap lower to fill at 19478.51 | * Showing Squeeze, w/ decreasing bullish momo + entering cycle low territory – Momentum Bearish MACD + 10 SMA > 34 EMA but, hooking down – price < 34 EMA – DMI bearish – price > 200 | + 10 SMA angling up with price above it. Bullish + price > 200 | |
| IWM Score: Daily: – 4 Weekly: -2 Monthly: 2 | – Touched Bottom of Keltner and sliding down – Momentum bearish showing Anti setup. Hasn’t hit measured move * Cycle Low: usually happens with Anti’s – Rainbow EMA converging and 8, 21, 34 crossed below. – price < 200 * has multiple measured move targets to the downside still. Including a support level | – Momentum Bearish MACD -DMI bearish + 10 SMA > 34 EMA but, hooking down and close to crossing and price is below 34. – Structurally broke bearish + price > 200 | + 10 SMA angling up with price below it. Bullish + price > 200 | |
| IYT Score: Daily: – 1 Weekly: – 1 Monthly: 1 | – Rainbow EMA bearish + price > 200, but consolidating at + Cycle Low near 200 * 78 min showing squeeze – Gap and 2 measured move target below to fill – Bottom Keltner touch | – Momentum Bearish MACD – Showing Squeeze with bearish momentum – DMI bearish + 10 SMA > 34 EMA but, hooking up w/ price belwo + price > 200 | + 10 SMA angling up with price below it. Bullish + price > 200 – Price keeps rejecting resistance | |
| TLT Score: Daily: 0 Weekly: – 2 Monthly: – 1 | + Touched top of keltner * Momentum MACD slow > 0 but flat and fast < 0 * Rainbow crossed positive 8 > 21 but EMA’s are flat – Big 200 rejection. | + MACD Momentum up – 10 sma < 32 ema but slowing – price < 200 – Cycle high at 34 EMA resistance * has not taken out previous pivot high | + Show Squeeze with positive momentum w/ Cycle low – 10 sma < 34 ema but, slowing – price < 200 | * At resistance. Look for a pullback if entering long. * Strength in TLT could slow equities |
| GLD Score: Daily: 1 Weekly: 2 Monthly: 1 | -Momentum fast > 0 and slow point down… At cycle high with a potential anti + Full rainbow and a bounce at the 34 ema. + price > 200 | – Couple of free bars with a strong bearish bar + 10 sma > 32 ema, price above 10 + price > 200 + MACD momo up but slowing + Top of Keltner touch – Cycle High * inside bar | + 10 SMA angling up with price below it. Bullish + price > 200 – Free bars | * Keltner pullback is deep even with cycle low * Daily momentum is slowing |
| AUDUSD Score: Daily: – 2 Weekly: – 2 Monthly: -3 | – Below 200 and rejected – Rainbow slowing but bearish * Still chopping around, a break of .64081 would change market structure bullish * bullish seasonality for AUD should kick in soon. | – Below 200 – Cycle high – Bottom Keltner touched without getting lower + MOMO up | – Squeeze starting w/ Berish momentum – below 200 – 10 sma < 34 ema and angling down | * Typically an indication the equities are to follow. Bearish == risk off * AUDJPY, looks the very similar |
| HG Score: Daily: 4 Weekly: 2 Monthly: 4 | + Top Keltner touch, complex pullback + MACD momentum fast angling up (near 0) and slow > 0 (but down) + Rainbow in play + price > 200 * Squeeze starting in 195 min | + MACD Up + 10sma > 34 ema + price > 200 – rejecting possible resistance | + price > 200 + 10 sma > 34 ema + Monthly squeeze with bullish momentum + Cycle low | * Interestingly enough, copper shows strength in China and by default AUD because of trade. * Shows strength in global economy, when copper is doing well, the world is usually growing. |
| BTCUSD Score: Daily: – 2 Weekly: 3 Monthly: 2 | + strong bounce off the 200 – Rainbow bearish – Lower Keltner hit, hasn’t reached pivot low – Daily MACD momentum < 0 – Formed a bear flag | + price > 200 – weekly momentum MACD down + At Cycle low + Rainbow bullish price barely holding 34 + 10sma > 34 ema | + 10sma > 34 ema + price > 200 | * US just announced a treasury reserve for crypto assets |
| China Semi Index Score: Daily: -3 Weekly: – 2 Monthly: 2 | – Price < 200 and consolidating – Decreasing upside momentum – Rainbow EMA bearish | * Showing a squeeze. – Bearish momentum – Market structural break bearish – DMI bearish + 10 SMA > 34 EMA but, price below | + 10 SMA angling up with price above it. Bullish + price > 200 | * Assigned negative points for weekly cycle considering the squeeze |
| Mag 7 Score: Daily: -4 Weekly: 1 Monthly: 2 | – Fired Squeeze to the downside (4-6 bars left) – Price lost 200and rejected – broke support to downside with and Anti showing – MACD momentum < 0 * Cycle low which will not align with Antis | + Squeeze starting with upside momentum decreasing + 10 SMA > 34 EMA but, price below – DMI bearish + Entering cycle low. – Bearish momentum MACD + price > 200 – Market structural break bearish | + 10 SMA angling up with price above it. Bullish + Price > 200 | * Points assigned to DMI and Cycle low for squeeze because they a bonus that cancel each other out. |
My Thoughts
I think the picture is getting clearer. Tech money is rotating into global equities. We are seeing gold slow down, TLT weaken while the MAG7 sells off. AUD is getting stronger, and the dollar may have found a bottom with the new Economist headline.
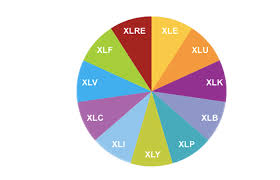
Nothing really stands out from the COTs report with the exception of XLB and XLP seems to have the retail investors caught off guard. Big money is setup to the short side while retail is looking long.
The rest of the market looks set for some sort of bounce this week based on where price is located on some of the bigger ETFs.
Trade Ideas
- MOS is my favorite XLB play. Might wait for an optimal entry in this stock for a short. (FCX and PPG are looking nice too)


Leave a Reply