

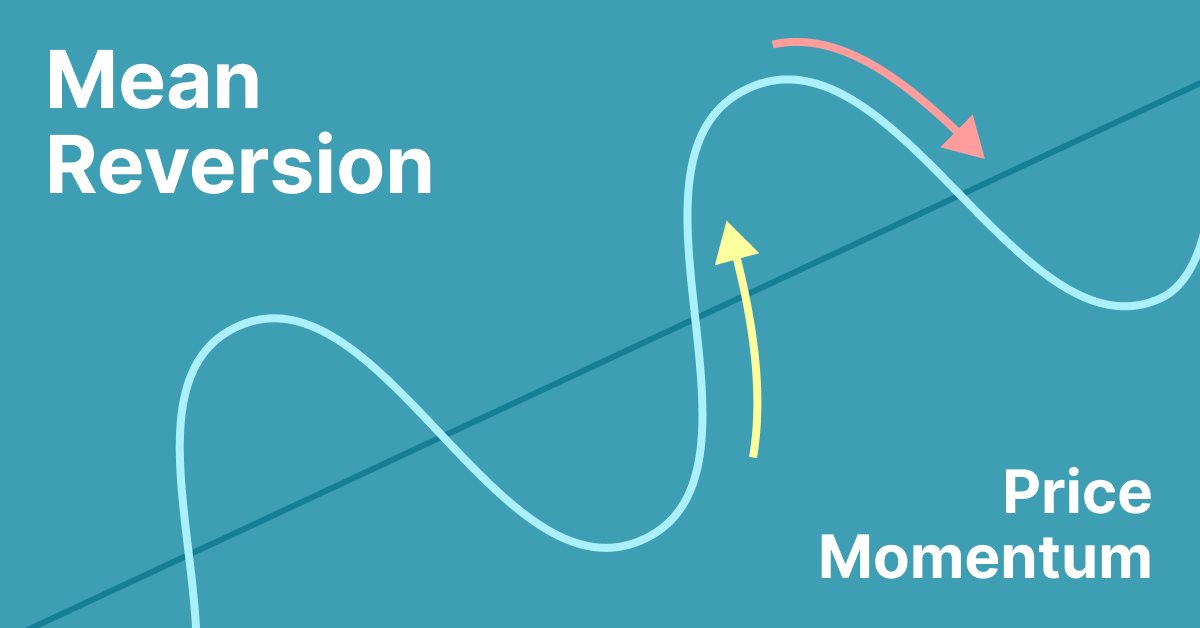
What is happening in the market this week is pure uncertainty but, I think I have a handle on one thing.
| Symbol | Daily | Weekly | Monthly | Notes |
| SPX Score: Daily: – 1 Weekly: – 2 Monthly: 2 | – Touched Bottom of Keltner + At Support and bounced – Momentum bearish showing Anti setup * Cycle Low: usually happens with Anti’s – Squeeze fired bearish: Might have 4-6 more bearish bars to go. – Rainbow EMA converging and 8 crossed below. + price > 200 | * Showing Squeeze – Cycle High – Momentum Bearish MACD + 10 SMA > 34 EMA but, hooking down – DMI bearish + price > 200 | + 10 SMA angling up with price above it. Bullish + price > 200 | |
| NDX Score: Daily: – 2 Weekly: – 1 Monthly: 2 | – Touched Bottom of Keltner + At Support and bounced – Momentum bearish showing Anti setup * Cycle Low: usually happens with Anti’s – Squeeze fired bearish: Might have 4-6 more bearish bars to go. – Rainbow EMA converging and 8 crossed below. + price > 200 | * Showing Squeeze – Cycle High – Momentum Bearish MACD + 10 SMA > 34 EMA but, hooking down – DMI bearish + price > 200 | + 10 SMA angling up with price above it. Bullish + price > 200 | |
| IWM Score: Daily: – 5 Weekly: 1 Monthly: 2 | – Touched Bottom of Keltner – Momentum bearish showing Anti setup * Cycle Low: usually happens with Anti’s – Squeeze fired bearish: Might have 3-5 more bearish bars to go. – Rainbow EMA converging and 8, 21, 34 crossed below. – price < 200 | – Momentum Bearish MACD + 10 SMA > 34 EMA but, hooking down and close to crossing and price is below 34. + price > 200 | + 10 SMA angling up with price below it. Bullish + price > 200 | |
| IYT Score: Daily: 1 Weekly: – 1 Monthly: 1 | – Rainbow EMA converging and 8 crossed below. + price > 200 + Cycle Low near 200 * 78 min showing squeeze | – Momentum Bearish MACD – Showing Squeeze with bearish momentum – DMI bearish + 10 SMA > 34 EMA but, hooking up w/ price above + price > 200 | + 10 SMA angling up with price below it. Bullish + price > 200 | |
| TLT Score: Daily: 2 Weekly: – 1 Monthly: – 1 | + Touched top of keltner + Momentum MACD > 0 + Rainbow crossed positive 8 > 21 – At the 200 in cycle high. Possible resistance. | + MACD Momentum up – 10 sma < 32 ema but slowing – price < 200 | + Show Squeeze with positive momentum w/ Cycle low – 10 sma < 34 ema but, slowing – price < 200 | * At resistance. Look for a pullback if entering long. * Strength in TLT could slow equities |
| GLD Score: Daily: 3 Weekly: 1 Monthly: 2 | + entering cycle low after touching Keltner *Momentum fast < 0 and slow point down + Full rainbow and a bounce at the 34 ema. + price > 200 | – Couple of free bars with a strong bearish bar + 10 sma > 32 ema, price above 10 + price > 200 | + 10 SMA angling up with price below it. Bullish + price > 200 | * Keltner pullback is deep even with cycle low * Daily momentum is slowing |
| AUDUSD Score: Daily: – 2 Weekly: – 2 Monthly: -3 | – Below 200 – Rainbow aligned bearish | – Below 200 – Cycle high | – Squeeze starting w/ Berish momentum – below 200 – 10 sma < 34 ema and angling down | * Typically an indication the equities are to follow. Bearish == risk off * AUDJPY, looks the very similar |
| HG Score: Daily: 5 Weekly: 4 Monthly: 4 | + Top Keltner touch, complex pullback + Cycle Low + MACD momentum fast angling up (near 0) and slow > 0 (but flat) + Rainbow in play + price > 200 * Bullish seasonality until 3/6 * Squeeze starting in 195 min | + Weekly top Keltner touch + MACD Up + 10sma > 34 ema + price > 200 | + price > 200 + 10 sma > 34 ema + Monthly squeeze with bullish momentum + Cycle low | * Interestingly enough, copper shows strength in China and by default AUD because of trade. * Shows strength in global economy, when copper is doing well, the world is usually growing. |
| BTCUSD Score: Daily: – 2 Weekly: 2 Monthly: 2 | + strong bounce off the 200 – Rainbow bearish – Lower Keltner hit – Daily MACD momentum < 0 | + price > 200 + potentially hit a cycle low after keltner touch + touch top of keltner – weekly momentum MACD down | + 10sma > 34 ema + price > 200 | * US just announced a treasury reserve for crypto assets |
| China Index Score: Daily: -1 Weekly: – 2 Monthly: 2 | + Price bounced at the 200. – Decreasing upside momentum – Rainbow EMA converging and 8 crossed below. | * Showing a squeeze. – Bearish momentum – Finished cycle low entering cycle high – DMI bearish + 10 SMA > 34 EMA but, hooking down | + 10 SMA angling up with price above it. Bullish + price > 200 | * Assigned negative points for weekly cycle considering the squeeze |
| Mag 7 Score: Daily: -2 Weekly: 2 Monthly: 2 | – Fired Squeeze to the downside (6-8 bars left) + Price bounced on 200 – broke support to downside with and Anti showing – MACD momentum < 0 * Cycle low which will not align with Antis | + Squeeze starting with upside momentum decreasing + 10 SMA > 34 EMA but, hooking down – DMI bearish + Entering cycle low. – Bearish momentum MACD + price > 200 | + 10 SMA angling up with price above it. Bullish + Price > 200 | * Points assigned to DMI and Cycle low for squeeze because they a bonus that cancel each other out. |
My Thoughts
Based on the table above, there is much uncertainty. I am slightly bearish overall, at least in the short term. Here is why:
- Equities are weak in respect to their daily scores
- “Leading” indicators such as bonds, AUDJPY + AUDUSD act as headwinds for equities. Bonds are strong and AUD is weak.
There is still uncertainty in the markets though:
- Price wants to hold the 200 on most daily charts
- US treasury is injected 170 billion dollars into the economy
- Trump announced a US Treasury Reserve of crypto
- What’s going to happen with Ukraine? EU relations with US?
- Tariffs?
Trade Ideas
- Copper is by far the strongest market to be in at this moment. I will be looking to take a long position in copper at some point this week. Likely once futures markets open.
- Looking for Anti pattern shorts in IWM stocks, especially ones with weak sectors.


Leave a Reply