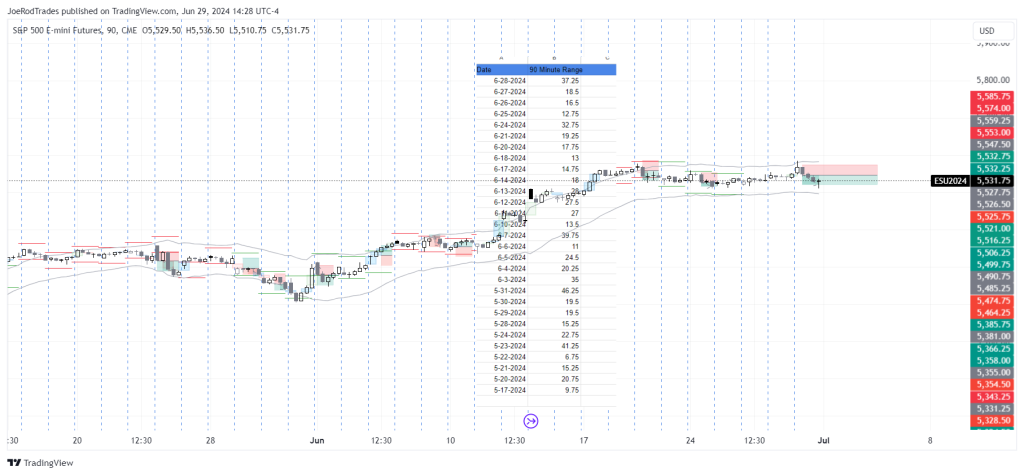
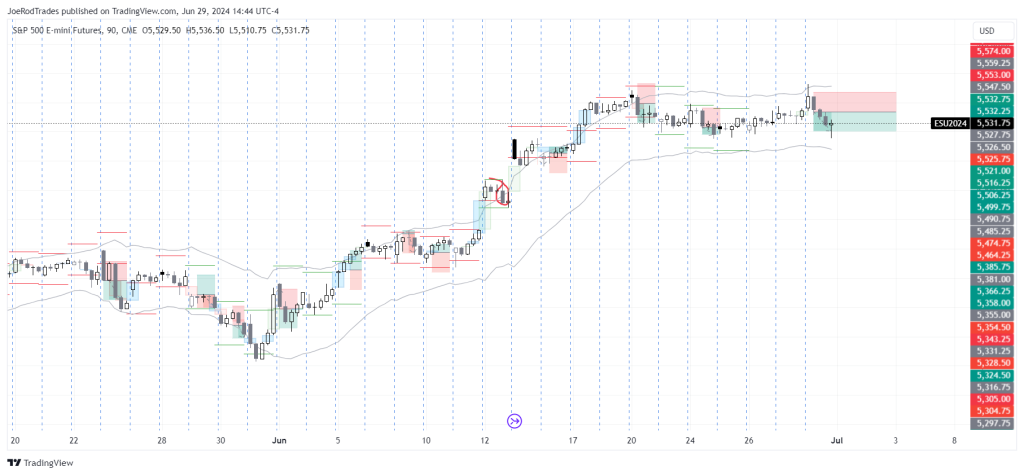
Last week on TradingView I posted a some data on the 90 minute range. Why the 90 range? According to Al Brook’s, the 90 minute range has an 90% change of giving us the high or the low of that day. Let’s dive into the data and see if this is actually true.
90 Minute Breakout Data

First let me point out a mistake I made in the TradingView article (thank you Gister!), there is one more loss to account for, I missed the second to last position (27th of June) so, the end results was 72% win percentage.
The data I collected was from 6-28 to 5-17 (I am still forward collecting) and it showed that the high or the low of the day was determined by the 90 minute range about 59% of the time. I concluded that Al Brook’s theory may have been debunked and proceed to still try to build a strategy from the 90 minute breakout.
The 90 Minute Breakout Strategy

While the sample size wasn’t huge, a 59% determination of a high or low of the day is still valuable. If at one point Brooks found a 90% determination of high or low then this means that most of the time, after 90 minutes, we have seen the high or low.
From this assumption we can look at how far price actually ran from high or low on average. Now that I think about it, I think a median may have been a better options. None the less, I took the distance price traveled from the 90 minute breakout (26.50 pts) and applied to every 90 minute breakout during the collected data timeframe.
We got about a 50/50 split of winners and losers with a return of 81pts over the course of 29 days. Not bad, but, what if we had a string of losers?
The Turtle Strategy
The turtles were a group of novice traders that were turned professional through an experiment. One of the concepts in the strategy that they were taught was to only place a trade after a potential trade was a loser.
Since the results above were 50/50 and I noticed that after a losing day there was a tendency to have a winning day, I realized that I could apply the same logic here. The results lead us to 100+ pts with a 71% win percentage on only 90 trades. This strategy has some legs for sure!
Building From This
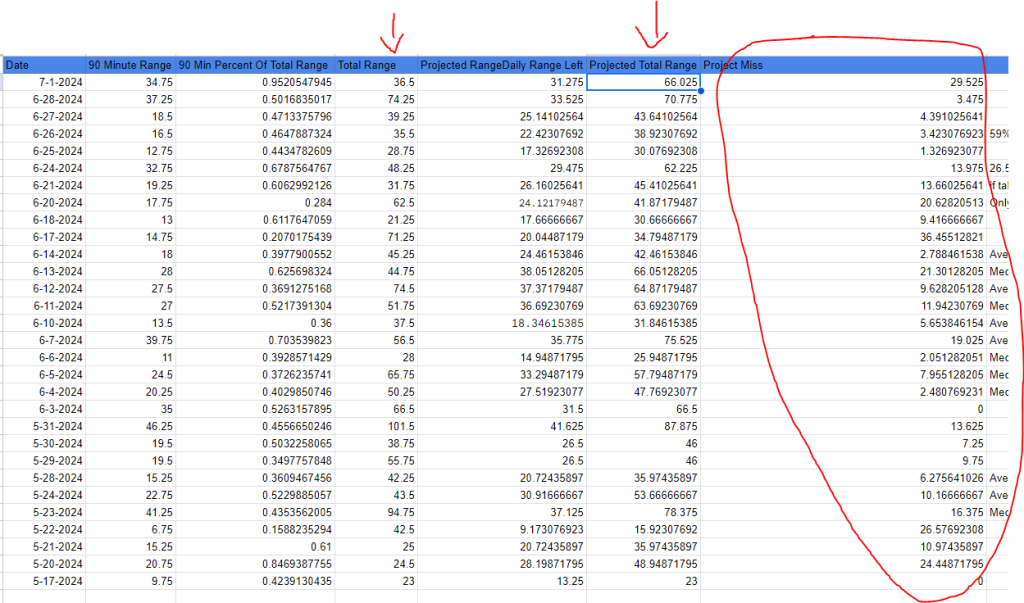
I wanted to understand how much of the total range the 90 minute range impacted. In other words, how much of the daily range have we seen after 90 minutes. This was on average about 48% of the entire range and a median of 46%. This was also dependent on the size of the opening range itself. Typically, an opening range larger than 31 pts would mean that we have seen a larger portion of the opening range. This makes sense but, it would also mean that we would likely see a larger range for the day.
All of this range talk reminds me of my article on VIX closes and their effect on the daily range. While I didn’t relate the VIX closes to the opening range (which I should), I did believe that we could create and predict an ongoing target for the direction of price. If we have the 90 minutes then we could get an idea of much further price could push in either directions.
The New Strategy
I wanted to back a theory where instead of using the average break out distance, we could have a dynamic price target. I did this by determining the median range of a 90 minute breakout and then applying to the median breakout percentage of the day. If the breakout was over the median then I would consider that it accounted for about 52% of the total range. If it was under, I would consider it to account for only 42% of the daily range. Using simple math and an excel spread sheet, here are the results.

Like anything else with trading, results can be hit or miss. I just want to point out how close some of these results are. Yes, there are a bunch of outliers but, I on average we were only off by 11.5 pts on average (median miss of 9.75) and some days I was spot on!
I used the projection of the day “Projected Range Daily Range Left” column and used that as a 1:1 target after 90 minute range was broken in either directions. As price traveled in the direction of the trade, I reduced the risk side equally (thinking about this IDK why). There are definitely better ways to set this up but, I wanted a trade easily to manage.
The Back Test

Another small sample size but, testing this made me realize something, so I stopped. I only won about 40% of the trades and the returns were 10.5pts for 26 trades. That sucks! But, that is not why I stopped.
As I continued to test the strategy, most of the exits for the strategy were at close because they were not managed. Many times, the strategy was in our favor and would reverse very quickly until close. Winners needed better management.
After a loser there was typically a winner. The turtle strategy, in theory, could apply to this strategy to improve it. I ran a quick test and it does but, it also reduces our sample size.
The last and most the biggest reason I stopped my testing was because I noticed that the total ranges and opening ranges of the ES between 11-27-2023 and 12-29-2023 were completely different than they are now. The one most recent test, I ran (6-20-2024) yielded the best results (24pts). While the back test was profitable, I concluded that they data that is collected, needs to be relevant to the time this strategy is traded.
Conclusion
After stepping through all of the data and completing a backtest, I did notice some very important key traits. The closer a trade was to breaking the 90 minute range to 11 EST, the better off the position would be. For instance, if a trade broke the 90 minute range at 13:00 EST we would often see a sharp reversal toward the end of the day. Couple this knowledge with my previous study on VIX closes and daily range and think we have a perfect way to frame the day.
The 90 minute range can currently be predicted within 10 points at a 58% clip (40 data points). The range itself gives you an idea of when to expect a reversal and when to take profit. I think I will need to go back and backtest the most recent data with the corresponding days. Using some type of scaling take profit system. Letting your trades just run all day and not managing them would be amazing but, that hardly ever works. So, that will be what I work on next.


Leave a Reply